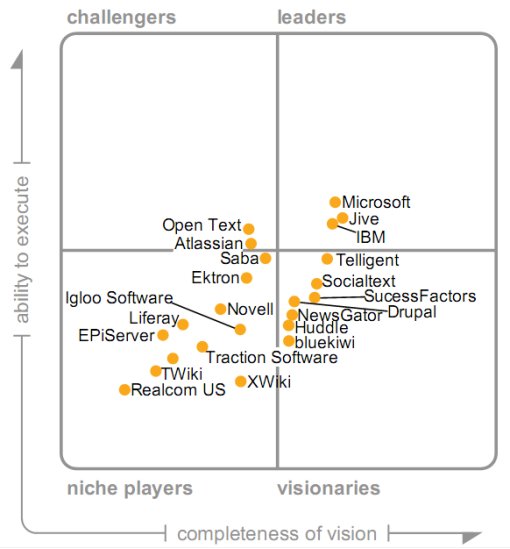
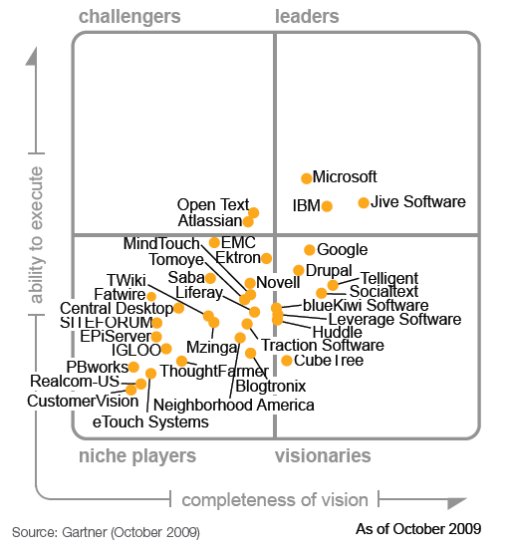
Gartner recently released their Magic Quandrant report for internal social software vendors. The below images are courtesy of Read Write Web. The first image is for 2010 the second is from last year. You can clearly see that this year there are a lot less vendors featured, you can read the RWW article on that to find out how the criteria has changed for this year’s report. I’m wondering if we might be putting too much weight on these types of reports. This post is more geared for folks who read/purchase these reports in the hopes of making some sort of a business decision as a result. I get that the space is still new and I feel that organizations looking to educate themselves about social software might be quick to put all their eggs in this so called “report basket.”
More in a minute, first the images.
I think these types of reports to a good job of providing an overall big picture of what’s going on in the vendor space and they help many people understand what the “market” looks like, but I’m hard pressed to see how a report like this can help a client. Recently Chess Media Group was involved in helping a large non-profit through the vendor selection process and none of the vendors we narrowed the list down to were mentioned above. We spent weeks breaking down use cases and understanding what every department needed from a vendor and how that would all work together. Only then were we able to put together a solid RFP. Basically what I’m trying to get at is these reports should not be used to make a short-list, vendor recommendations, purchase decisions, or anything else of that nature.
Keep in mind that these reports also serve as a great lead gen tool for the organizations that are creating them, after all, who wouldn’t want to be a “leader” or a “visionary” in social software right? Furthermore, when we’re in such a rapidly evolving and changing market such as internal and/or external social software, how much relevance do these reports really have? I can’t be too negative on them though because I think many of the analyst firms out there (Gartner is one of them) do great work, and heck, I read all of these reports as well.
In my opinion (and of course I can be wrong) these reports:
- Are too broad and general to have any implications to any specific client
- There is no distinction between vendors for vertical or company side, i.e. enterprise and mid size, financial sector and pharma
- The space is changing too rapidly for this to be relevant
- Several vendors themselves are having issues with these reports and their validity and method
Chris Yeh from PB Works, left the following comment on the RWW post:
“One quick note–at PBworks, we specifically requested that Gartner stop including us in these Magic Quadrant reports. When we discussed the quadrant criteria with the analysts, we discovered that some of the criteria (e.g. offering both hosted and on-premise solutions) would always penalize 100% SaaS companies like PBworks.
Given the fact that we (who had been featured in MQ several times in the past) were unaware of these criteria, we figured that potential customers might be unaware as well, and would rather our product be judged on its own rather than misjudged based on a 3rd-party report.”
Aaron Fulkerson, the CEO of Mindtouch, had the following to say:
“Consistently over the last four years MindTouch has had difficulty getting a briefing with the MQ principals. It’s always last minute and is only for 15-30 minutes. No demo is conducted. No workbench evaluation of the software. Seriously, how do you assess software without using it? In previous years, to my knowledge, they only spoke with three customers. For an analysis it’s short on the analysis. Buyers referencing this report should seriously consider this fact. As for why MindTouch was not included this year, I’m told MindTouch had a short period of time to get five customers with 5,000+ users into a briefing. Apparently we did not get all five customers scheduled in the appointed period of time with the appointed calendar openings. :-(“
Reading over comments like this from vendors really makes one wonder whether anybody should be reading these reports at all. Are the images pretty? Yes. Can any organization look at these reports and make any type of useful, relevant, actionable decision? Probably not. Richard Hughes the Director of Product Strategy at BroadVision had this to say and I think it sums things up nicely(taken from RWW comments:)
Yes, I think they do. I have heard many, many times of buyers using them to create their shortlist. The danger is buyers using them “lazily”, simply taking the leader quadrant, and ignoring everything else. As a Gartner analyst once said to me “there are only two axes on the MQ – broadness of vision and ability to execute”. This “ability to execute” axes naturally favours big companies like Microsoft and IBM and penalizes smaller, specialist vendors who often have much better products.
Again, I don’t want to make it sound like these reports are useless but I think that when people read them they should really understand what they are reading and why. It also wouldn’t hurt these analyst firms if they did a little bit around educating readers as to how these reports should used and what value they provide.
Please do not make your decisions based off these reports, use them for more of a very high level big picture idea of what’s going on. What do you think? Am I way off the mark on this one? How would you change or improve the reports?


Good points, Jacob. I'll add one more – the Gartner criteria exclude any products which require a platform (it's okay for a product to need a database, but it can't require SharePoint for example). So this excludes NewsGator's Social Sites products which integrate tightly with SharePoint. Here's a bit more depth on this: http://blogs.newsgator.com/daily/2010/10/sharepoint-mystical-grids-and-enterprise-social-computing.html
Everyone should take all these ratings with some pause, as there as specific conditions which could make one platform better than another. I do like the idea of basic criteria, but I would prefer to see a fair and balanced comparison based on feature and usability, than simply install base, and size of company.
I head up the Office of the Ombudsman at Gartner. I see some thoughtful comments in and on this post related to the usage of the Gartner Magic Quadrant for vendor selection and wanted to add my own. A bit of background on the Magic Quadrant (MQ): it is intended to be used as an early step in understanding the technology or service providers in a particular market. An MQ can help a user to hone a list of choices, but of course should not be used as the only data point in the decision-making process.
As expressed in other blogger comments dot placement alone does not tell any vendor’s full story. That’s why it is important to read the document itself and not simply look at the graphic. Put simply, the appropriate solution is often not in the Leaders’ Quadrant. We also advise clients to discuss their specific requirements with the analyst directly.
The process used to create this document is the same as for all MQs – here’s a link to some more information: http://tinyurl.com/27n4tjh. I also noticed that you compared the 2009 and 2010 MQ graphics. We advise our clients not to do this because the criteria changes as the market evolves, so contrasting reports year over year is not a like-for-like comparison. For example, the 2010 MQ required more number references and active users in those references, and the threshold for the total number of active users also increased. I would also like to say that client status is not a factor in determining inclusion or positioning in our research reports – I blogged about it some time ago here: http://tinyurl.com/yhh2u2b.
Nancy Erskine, Ombudsman
These reports provide buyers a cover your ass blanket. How could the decision be bad, Gartner said they are leaders. It is also easy to get onto these. You just need to pay for the service of being placed on them… These graphs could have great value if they were clearlt connected to use case examples. It would be very interesting to be able to pick a business problem and then filter the graph based on just that problem versus someones wide view of what should happen. Looking at the most recent one I am hard pressed to even see what all of these companies have in common…